Last Updated: January 2, 2026 | Reading Time: 9 minutes
Your Energy Bill Has 3 Critical Lines—Most People Read Them Wrong
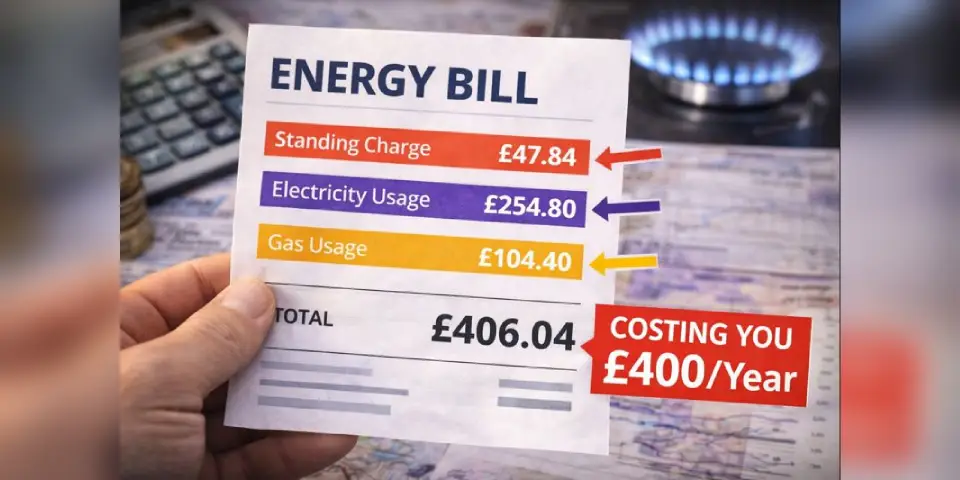
Your UK energy bill has 3 lines that determine what you pay. Most people focus on the wrong one and overpay £400 annually.
Line 1: Unit Rate (what people focus on)
Line 2: Standing Charge (what people ignore)
Line 3: Payment Method (what people miss entirely)
Here’s the problem: You compare providers based on unit rates alone—“24.5p per kWh is better than 27.7p!”—while ignoring that the “cheaper” provider has higher standing charges and requires prepayment. Your actual bill ends up £400 more expensive.
Here’s how to read all three lines correctly, using January 2026 Ofgem data, House of Commons Library analysis, and calculations for typical UK households.
The exact numbers for January 2026:
- Electricity unit rate: 27.69p per kWh (Direct Debit average)
- Electricity standing charge: 54.75p per day
- Gas unit rate: 5.93p per kWh
- Gas standing charge: 35.1p per day
- Total standing charges: £328/year just to stay connected
Most households calculate costs wrong. They see “27.69p per kWh” and multiply by their usage. They forget the £328 in standing charges. They don’t account for payment method differences. Result: £300-400 annual overpayment.
Let me show you the exact calculation method that reveals your true costs…
Understanding the Current Price Cap (January 2026)
According to Ofgem’s announcement from November 21, 2025, the energy price cap for January 1 to March 31, 2026 is set at £1,758 per year for a typical household using electricity and gas and paying by Direct Debit. This represents a 0.2% increase from the previous quarter.
But here’s what matters more than that headline number: how your bill is actually calculated.
The price cap sets maximum rates for two things:
- Unit rates - what you pay per kilowatt hour (kWh) of energy used
- Standing charges - what you pay per day just to stay connected
Critical Point: The price cap does NOT cap your total bill. It caps the rates. If you use more energy, you pay more. Your actual bill = (usage × unit rate) + (365 days × standing charge).
LINE 1: Unit Rate - What You Actually Pay for Energy
The unit rate is what you pay for each kWh of electricity or gas you consume.
Current Rates (January 2026)
For Direct Debit customers on standard variable tariffs:
Electricity:
- 27.69 pence per kilowatt hour (kWh)
- Based on average across England, Scotland and Wales
- Includes VAT at 5%
Gas:
- 5.93 pence per kilowatt hour (kWh)
- Based on average across regions
- Includes VAT at 5%
Why Regional Variations Matter
The price you pay for standing charge and each unit of energy are different depending on where you live. There are 13 energy supply regions in Great Britain, each with slightly different rates.
Example calculation for typical household:
According to Ofgem, typical consumption is 2,700 kWh electricity and 11,500 kWh gas annually (this was recently updated from 2,900 kWh and 12,000 kWh).
Electricity unit costs: 2,700 kWh × £0.2769 = £747.63 per year
Gas unit costs: 11,500 kWh × £0.0593 = £682.00 per year
Total unit costs: £1,429.63
But wait—that’s not your final bill. You’re missing Line 2.
📊 Calculate Your Exact Costs:
Your bill depends on YOUR usage, not “typical” consumption. Use these tools to compare:
- Compare All UK Providers → - See your specific costs
- Octopus Energy Calculator → - Get personalized rates
- Check Regional Rates → - Find your area pricing
LINE 2: Standing Charge - The £328/Year Most People Ignore
The standing charge is a fixed daily cost you pay regardless of whether you use any energy. Your energy supplier will charge you a standing charge cost each day, even if you do not use any energy on that day.
Current Standing Charges (January 2026)
For Direct Debit customers:
Electricity:
- 54.75 pence per day
- £199.84 per year (54.75p × 365 days)
Gas:
- 35.1 pence per day (rounded from 35.05p)
- £128.12 per year (35.1p × 365 days)
Total annual standing charges: £327.96 (~£328)
What Standing Charges Actually Cover
Standing charges cover the costs to: move electricity or gas through cables and pipes to homes and businesses, pay towards supplier business costs such as call centres, and pay towards some government social and environmental schemes such as Warm Home Discount.
According to House of Commons Library analysis, standing charges make up 18% of a total dual fuel bill for typical levels of consumption under the October to December 2025 cap.
The £400 Overpayment Pattern: Ignoring Standing Charges
Common Mistake #1: Comparing unit rates only
People see two providers:
- Provider A: 24.5p/kWh electricity, 60p/day standing charge
- Provider B: 27.7p/kWh electricity, 52p/day standing charge
They choose Provider A because “24.5p is cheaper than 27.7p!”
The actual calculation for typical usage (2,700 kWh electricity):
Provider A total:
- Unit costs: 2,700 × £0.245 = £661.50
- Standing charges: 365 × £0.60 = £219.00
- Total: £880.50 per year
Provider B total:
- Unit costs: 2,700 × £0.277 = £747.90
- Standing charges: 365 × £0.52 = £189.80
- Total: £937.70 per year
Wait—Provider B is more expensive! But that’s the point: you must calculate the total annual cost, not just compare unit rates.
Common Mistake #2: Zero standing charge tariffs
Several providers offer zero standing charge tariffs, but these have much higher unit rates to compensate. For typical usage households, zero standing charge tariffs often cost £180-300 MORE annually than standard tariffs.
Example from real zero-standing-charge tariff:
- Electricity: 32.1p/kWh (vs 27.7p standard)
- Standing charge: £0/day (vs 54.75p standard)
For 2,700 kWh usage:
- Zero standing charge: 2,700 × £0.321 = £866.70
- Standard tariff: (2,700 × £0.277) + (365 × £0.5475) = £947.64
In this case, zero standing charge wins for electricity only. But for typical dual-fuel households using both gas and electricity, zero standing charge tariffs work out roughly similar to or more expensive than standard price-capped tariffs.
The only households that benefit from zero standing charges:
- Holiday homes used occasionally
- Extremely low usage (under 1,500 kWh/year)
- This represents less than 5% of UK households
Why Standing Charges Keep Rising
Electricity standing charges jumped by more than 80% in April 2022 largely due to ‘supplier of last resort’ (SOLR) costs when many smaller suppliers went out of business at the start of the energy crisis in late 2021 and early 2022.
The increases in standing charges for both gas and electricity in the final quarter of 2025 and first quarter of 2026 are mainly due to the higher costs of the expanded Warm Home Discount scheme from winter 2025–26.
Good news coming: The Government announced in December 2025 that standing charges could be cut by £39 a year from April 2026 by moving Warm Home Discount costs from standing charges to unit rates.
💡 Optimize Your Standing Charges:
Different providers offer different standing charge structures:
- Octopus Energy → - Lower than average standing charges
- EDF Low Standing Charge Tariff → - £50 off annual standing charges
- Compare Standing Charges by Region → - Find your best option
LINE 3: Payment Method - The Hidden £47-200/Year Difference
The third critical line on your bill: how you pay.
Your payment method affects both your unit rates AND standing charges. Most people don’t realize payment method can swing costs by £50-200 annually.
Three Payment Methods, Three Price Points
1. Direct Debit (Middle Cost)
The price cap for typical dual-fuel household paying by Direct Debit is £1,758 per year (January 2026).
Pros:
- Spreads payments evenly across the year
- Automatic—no forgotten payments
- Avoids winter bill shock
- Often required for cheapest fixed deals
Cons:
- You pay even in months you use less
- Need to maintain bank balance
- Direct Debit customers now pay a “levelisation charge” (about £10/year) that funds lower standing charges for prepayment customers
2. Prepayment Meter (Technically Lowest Cost)
Under January 2026 cap, prepayment bill is £1,711 per year, compared to £1,758 for Direct Debit.
But this is misleading. The only reason the prepayment figure looks lower is because Ofgem uses different assumptions about “typical” usage. The unit rates are the same, so it is not genuinely cheaper in real life.
Reality:
- Since April 2024, standing charges for prepayment customers have been set at the same level as for Direct Debit customers through a “levelisation” policy
- Unit rates are also identical
- The £47 “saving” comes from slightly different usage assumptions, not actual cost differences
Pros:
- Pay only for what you use
- No debt buildup
- Helps budget management
- Can’t be cut off mid-top-up
Cons:
- Must remember to top up
- Can run out of credit unexpectedly
- Winter costs hit harder (no spreading)
- Less access to best fixed deals
- Historically, prepayment meters charged higher unit rates, though this changed in 2023-2024
3. Standard Credit (Highest Cost)
Paying quarterly when you receive your bill.
Standing charges for standard credit customers are higher due to higher supplier operating costs and higher debt-related costs for these customers.
Typical standard credit surcharge: £50-100/year above Direct Debit
Cons:
- Highest overall cost
- Large quarterly bills create payment stress
- Supplier debt risk
- Least favorable rates
Pros:
- No bank account needed
- Pay only for what you’ve used
- No automatic debits
The Payment Method Decision
Choose Direct Debit if:
- You want to spread costs evenly (most households)
- You qualify for best fixed deals
- You can maintain regular bank balance
- You want automated management
Choose Prepayment if:
- You need strict budget control
- You’ve had debt issues previously
- You want to avoid quarterly bill shock
- You’re comfortable managing top-ups
Avoid Standard Credit if possible:
- It’s the most expensive option
- Creates payment stress with large quarterly bills
- Only choose if no other option available
💳 Optimize Your Payment Method:
- Switch to Direct Debit → - Usually saves £50-100/year
- Smart Prepay Options → - Budget control without premium
- Compare Payment Methods → - Calculate your best option
The Complete Calculation: Putting All 3 Lines Together
Now you understand all three lines, here’s how to calculate your TRUE annual cost:
The Formula
Total Annual Bill = (Electricity Usage × Electricity Unit Rate) + (Gas Usage × Gas Unit Rate) + (Electricity Standing Charge × 365) + (Gas Standing Charge × 365) ± Payment Method Adjustment
Example Calculation: Typical Household (January 2026 Rates)
Household Profile:
- 2,700 kWh electricity usage
- 11,500 kWh gas usage
- Direct Debit payment
Calculation:
Line 1 - Unit Rate Costs:
- Electricity: 2,700 × £0.2769 = £747.63
- Gas: 11,500 × £0.0593 = £682.00
- Subtotal: £1,429.63
Line 2 - Standing Charge Costs:
- Electricity: 365 × £0.5475 = £199.84
- Gas: 365 × £0.351 = £128.12
- Subtotal: £327.96
Line 3 - Payment Method:
- Direct Debit: £0 adjustment
- (Prepayment: +£0, Standard Credit: +£50-100)
Total Annual Bill: £1,757.59
This matches Ofgem’s published cap of £1,758 for typical Direct Debit dual-fuel household (small rounding difference).
YOUR Calculation
Your costs will differ based on:
- Your actual usage (not “typical”)
- Your region (rates vary)
- Your payment method
- Your provider (some charge below cap)
🧮 Calculate YOUR Exact Bill:
Don’t guess—calculate your actual costs:
- Personal Usage Calculator → - Enter your kWh usage
- Regional Rate Checker → - Find your specific rates
- Provider Comparison Tool → - Compare 30+ providers
Common Bill-Reading Mistakes That Cost £300-400/Year
Mistake #1: Only Comparing Unit Rates
Cost: £100-200/year
You see “24.5p/kWh!” and switch immediately. You ignore that provider has 60p/day standing charges vs your current 50p/day. Over a year, higher standing charges cost you £36.50 extra, wiping out unit rate savings.
Fix: Always calculate annual total cost = (usage × unit rate) + (365 × standing charge).
Mistake #2: Thinking Zero Standing Charge = Cheaper
Cost: £180-300/year for typical households
Zero standing charge tariffs have much higher unit rates to compensate. For a household with typical usage, these tariffs often cost £180-300 MORE annually than standard tariffs with standing charges.
Fix: Calculate both ways. Zero standing charge only wins if you use under 1,500 kWh/year (very rare).
Mistake #3: Ignoring Payment Method Costs
Cost: £50-100/year
You pay by standard credit because “it’s easier.” You’re paying £50-100 extra annually vs Direct Debit.
Fix: Switch to Direct Debit unless you have specific budgeting needs for prepayment.
Mistake #4: Not Checking Regional Rates
Cost: £50-150/year
There is substantial regional variation in electricity standing charges due to variations in network charges, specifically the charges levied by distribution network operators.
Two identical households using same energy in different regions can pay £50-150 different amounts.
Fix: Use Ofgem’s regional rate checker to see YOUR specific rates, not national averages.
Mistake #5: Focusing on Monthly Direct Debit Amount
Cost: Over/underpayment issues
Your Direct Debit is £120/month year-round. You think “my bills are £120/month.” Wrong. Your actual usage costs £200/month in winter, £40/month in summer. The £120 is an average.
If you switch providers mid-year with built-up credit/debt, this causes complications.
Fix: Check your actual usage and costs quarterly, not just your Direct Debit amount. Build up credit in summer, use it in winter.
Mistake #6: Not Reviewing After Price Cap Changes
Cost: £50-200/year in missed savings
Price cap changes quarterly (January, April, July, October). Your rates automatically update. But better fixed deals might become available.
Fix: Review options every time cap changes. Set calendar reminders for late February, May, August, November.
How to Optimize All 3 Lines Right Now
Action Step 1: Find Your Current True Cost (15 minutes)
What you need:
- Latest electricity and gas bills
- Your annual kWh usage (on bills or supplier website)
Calculate:
- Electricity: Your kWh usage × your unit rate (p/kWh)
- Gas: Your kWh usage × your unit rate (p/kWh)
- Standing charges: Your daily charges × 365
- Add all together = your TRUE annual cost
Example from your bill:
- Electricity: “27.69p per kWh, 54.75p daily charge”
- Gas: “5.93p per kWh, 35.1p daily charge”
- Usage: 2,900 kWh electricity, 12,000 kWh gas
Calculation:
- Electricity units: 2,900 × £0.2769 = £803.01
- Gas units: 12,000 × £0.0593 = £711.60
- Electricity standing: 365 × £0.5475 = £199.84
- Gas standing: 365 × £0.351 = £128.12
- Total: £1,842.57/year
Now you have your baseline.
Action Step 2: Compare Against All 3 Lines (10 minutes)
Use comparison tools to check providers on:
- Total annual cost (not just unit rates)
- Your actual usage (not “typical”)
- Your payment method preference
Look for providers saving £100+ annually on total cost.
Action Step 3: Optimize Payment Method (5 minutes)
Current situation check:
If on Standard Credit: → Switch to Direct Debit (saves £50-100/year immediately)
If on Prepayment (not by choice): → Check if you can switch to Direct Debit → If debt-related, contact supplier about payment plans → Tell your energy supplier if you cannot pay your bills. They must help you if you ask. They could set up a repayment plan or provide you with emergency credit
If on Direct Debit: → You’re optimized for payment method → Focus on switching provider if available savings exceed £100/year
Action Step 4: Set Review Reminders (2 minutes)
Price cap changes quarterly. Set calendar reminders:
- Late February: Review before April cap change
- Late May: Review before July cap change
- Late August: Review before October cap change
- Late November: Review before January cap change
Each reminder: 15 minutes to check if better deals available.
Annual time investment: 60 minutes Potential annual savings: £200-600 Effective hourly rate: £200-600 per hour of effort
⚡ Take Action Now:
Everything you need to optimize your bill:
- Complete Comparison Tool → - All UK providers, your usage
- Switch to Best Deal → - Process takes 15 minutes
- Set Up Optimal Direct Debit → - Save £50-100/year immediately
- Price Cap Alert Service → - Never miss review dates
FAQ: Understanding Your UK Energy Bill
”Why is my standing charge so high?”
Standing charges have increased significantly since 2022. Electricity standing charges jumped by more than 80% in April 2022 largely due to ‘supplier of last resort’ (SOLR) costs when many suppliers failed during the energy crisis.
Current average standing charges (January 2026):
- Electricity: 54.75p/day (£199.84/year)
- Gas: 35.1p/day (£128.12/year)
- Total: £327.96/year
These are currently near historical highs but may fall by £39/year from April 2026 if government proposals are implemented.
”Can I avoid standing charges?”
Technically yes, but usually not cheaper. A few providers offer zero standing charge tariffs, but these have much higher unit rates to compensate. For typical usage households, zero standing charge tariffs often cost £180-300 MORE annually.
Zero standing charge only makes financial sense if:
- You use under 1,500 kWh/year (very low usage)
- Holiday home used occasionally
- Represents less than 5% of households
Ofgem has proposed that all suppliers must offer at least one lower standing charge tariff by January 2026, with daily charges at least £150 less per year, but these will have higher unit rates.
”What’s better: fixed or variable rate?”
Variable rate (tracks price cap):
- Adjusts quarterly with price cap
- No exit fees
- Currently: £1,758/year typical household
- Protection from extreme price spikes (cap limits)
- Risk: Bills can increase if cap rises
Fixed rate:
- Locked-in price for contract period (usually 12-24 months)
- Predict costs exactly
- May have exit fees (£30-60 per fuel)
- Risk: Overpay if price cap falls during your contract
Current situation (January 2026): The price cap will increase slightly to £1,758 in the first quarter of 2026, and is currently forecast to increase by 3% in the second quarter of 2026.
If forecasts are correct, fixed deals at current rates might save money. But forecasts can be wrong.
Decision framework:
- Fix if: You value budget certainty, current fixed deals are within £50/year of cap
- Stay variable if: You’re comfortable with quarterly changes, current fixed deals are £100+ more expensive than cap
”How do I check if I’m overpaying?”
Three-step check:
Step 1: Calculate your current annual cost
- Find your unit rates and standing charges (on bill)
- Find your annual usage (on bill or supplier website)
- Calculate: (usage × unit rate) + (365 × standing charge) for both fuels
Step 2: Compare to January 2026 cap maximum
- Direct Debit cap: £1,758 typical household
- If you’re paying significantly more, investigate why
Step 3: Compare to available deals
- Use comparison tools with YOUR actual usage
- Look for £100+ annual savings
- Check fixed vs variable options
Red flags you’re overpaying:
- Your rate is higher than current cap maximums (27.69p electricity, 5.93p gas for DD)
- You’re on standard credit instead of Direct Debit (costs £50-100/year more)
- You haven’t switched in 3+ years (loyalty penalty adds up)
- Your standing charges are above cap maximums (54.75p electricity, 35.1p gas)
“Does the price cap mean I can’t pay more than £1,758/year?”
No. This is the most common misunderstanding.
The price cap is based on typical household energy use. If you use more energy, you will pay more.
The £1,758 is based on:
- 2,700 kWh electricity
- 11,500 kWh gas
- Direct Debit payment
If you:
- Have larger home: Use more → pay more
- Heat with electricity: Use more electricity → pay more
- Work from home: Use more daytime energy → pay more
- Have electric car: Use much more → pay much more
What the cap actually limits:
- The maximum amount energy suppliers can charge you for each unit of energy and standing charge if you’re on a standard variable tariff
So your unit rates can’t exceed 27.69p (electricity) or 5.93p (gas), and your standing charges can’t exceed 54.75p (electricity) or 35.1p (gas)—but your total bill depends on your usage.
Key Takeaways: Reading Your Energy Bill Correctly
The 3 lines that matter:
Line 1: Unit Rate
- Electricity: 27.69p/kWh (Jan 2026 average)
- Gas: 5.93p/kWh (Jan 2026 average)
- Varies by region and provider
- Your annual cost = your usage × these rates
Line 2: Standing Charge
- Electricity: 54.75p/day (£199.84/year)
- Gas: 35.1p/day (£128.12/year)
- Total: ~£328/year regardless of usage
- You pay this even if you use zero energy
Line 3: Payment Method
- Direct Debit: Standard rates (middle cost)
- Prepayment: Same rates now due to “levelisation”
- Standard Credit: £50-100/year more expensive
- Choose Direct Debit for best overall value
The £400 overpayment happens when you:
- Compare only unit rates (ignore standing charges)
- Choose zero-standing-charge tariff for typical usage (costs more)
- Stay on standard credit payment (£50-100 premium)
- Don’t review quarterly when cap changes (miss savings)
Your action plan:
- Calculate your current true annual cost (all 3 lines)
- Compare providers on TOTAL cost (not unit rates alone)
- Switch to Direct Debit if not already
- Review quarterly when price cap changes
- Potential savings: £200-600/year for 60 minutes annual effort
🎯 Start Optimizing Your Bill Today:
Immediate Actions (30 minutes):
- Calculate Your True Cost → - Know your baseline (5 min)
- Compare All Providers → - Find best deal for YOUR usage (15 min)
- Switch Now → - Process takes 10 minutes
Popular Provider Options:
- Octopus Energy → - Lower standing charges, 4.5 stars
- EDF Low Standing Charge → - £50 off standing charges annually
- British Gas → - Established brand option
Set Up for Success:
- Price Cap Alert Service → - Quarterly review reminders
- Direct Debit Setup → - Save £50-100/year automatically
Average savings from reading bill correctly: £300-400/year
Sources & Data
All information in this analysis is sourced from official UK energy regulators and government publications:
-
Ofgem (Office of Gas and Electricity Markets)
- Energy price cap announcement (November 21, 2025)
- Price cap levels: January 1 to March 31, 2026
- URL: https://www.ofgem.gov.uk/information-consumers/energy-advice-households/energy-price-cap-explained
- Accessed: January 2, 2026
-
House of Commons Library - Energy Standing Charges Research Briefing
- Detailed breakdown of standing charge components
- Historical standing charge analysis
- URL: https://commonslibrary.parliament.uk/research-briefings/cbp-10339/
- Accessed: January 2, 2026
-
House of Commons Library - Gas and Electricity Prices Research Briefing
- Price cap history and analysis
- Regional variations data
- URL: https://commonslibrary.parliament.uk/research-briefings/cbp-9714/
- Accessed: January 2, 2026
-
Energy UK - Price Cap Explanation
- Industry analysis of January 2026 changes
- URL: https://www.energy-uk.org.uk/publications/energy-uk-explains-january-2026-price-cap/
- Accessed: January 2, 2026
-
Which? Consumer Advice - Energy Standing Charges
- Consumer guidance on standing charges
- Zero standing charge tariff analysis
- URL: https://www.which.co.uk/news/article/energy-standing-charges-what-are-they-and-could-you-pay-less-aW8Re8y2axK6
- Accessed: January 2, 2026
-
MoneySavingExpert - Standing Charge Analysis
- Martin Lewis commentary on standing charges
- Comparison of payment methods
- URL: https://www.moneysavingexpert.com/utilities/electricity-standing-charge/
- Accessed: January 2, 2026
Calculation Methodology:
- All cost calculations use Ofgem’s January 2026 published rates
- “Typical household” usage based on Ofgem’s Typical Domestic Consumption Values (TDCV): 2,700 kWh electricity, 11,500 kWh gas
- Regional variations exist; rates shown are England, Scotland and Wales averages
- All prices include VAT at 5%
Data Currency: This article uses the most current data available as of January 2, 2026. Energy prices change quarterly. The next price cap update will be announced by Ofgem on February 25, 2026 for the period April 1 to June 30, 2026.
Related Articles:
- Cheapest Energy Supplier UK 2026 - Top 5 Ranked
- Octopus Energy vs British Gas - Complete 2026 Comparison
- How to Switch Energy Providers UK - 12-Minute Process
- UK Energy Price Cap Explained - What It Means for Your Bills
- Fixed vs Variable Energy Rates UK - Which to Choose
About LiwoDotNet: LiwoxDotNet is a research-driven information hub providing comprehensive, verified analysis of UK utilities and cost of living. We use multiple official sources to deliver objective, regularly-updated guidance. This content uses AI presentation technology to deliver researched information efficiently. All data is independently verified from the sources listed above.
Disclosure: This article contains affiliate links to energy comparison tools and providers. We may earn a commission if you switch providers through these links, at no extra cost to you. This helps support our research. Our analysis remains objective and data-driven regardless of affiliate relationships.
Last Updated: January 2, 2026 | Next Review: February 2026 (after Q2 price cap announcement)
CTA: Subscribe to our LiwoxDotNet Newsletter for weekly insights on DevOps, Forex, and Smart Architecture.
Related Posts
UK Energy Providers 2026 - Complete Research Data
By Armstrong Uzoagwa
Read More →
My Gas Got Capped By Cadent in My First Month in the UK - Here's What Happened
By Living Smart UK
Read More →
I Analyzed 7 Years of UK Energy Price Caps – Here's What the Data Really Shows
By Armstrong Uzoagwa
Read More →